LEGO Visualisations – Combining my love for LEGO, Python and Tableau
Using Tableau to visualise the diversity of LEGO sets.
 Chris ThamSat Mar 12 2016
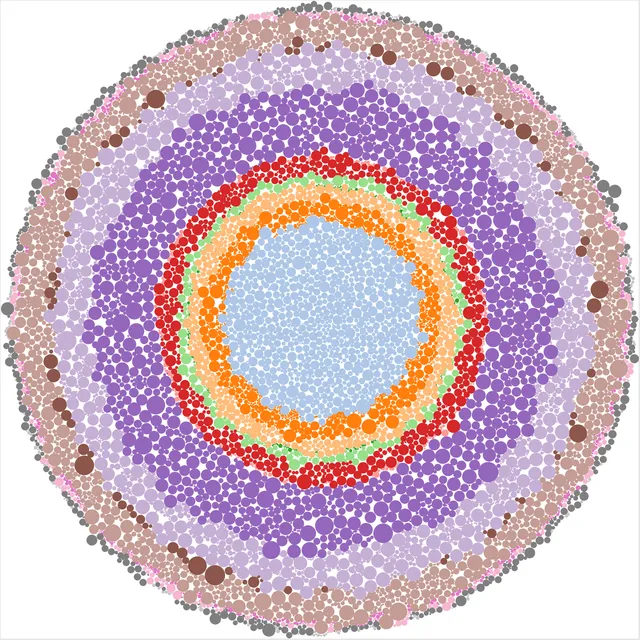
I am a lover of LEGO (I think the official term for people like me is “Adult Fan Of LEGO”) and not ashamed to admit i have bought way too many LEGO sets and likely to buy more.
Lately I have also been using Python to do various data ingestion and wrangling tasks (along with R). I recently learnt both languages by signing up to a few courses on Coursera.
And of course I have been using Tableau for a while now.
Recently I discovered the popular LEGO fan website Brickset.com has quite an extensive database of LEGO sets. It even has a Web Services API to enable the database to be queried.
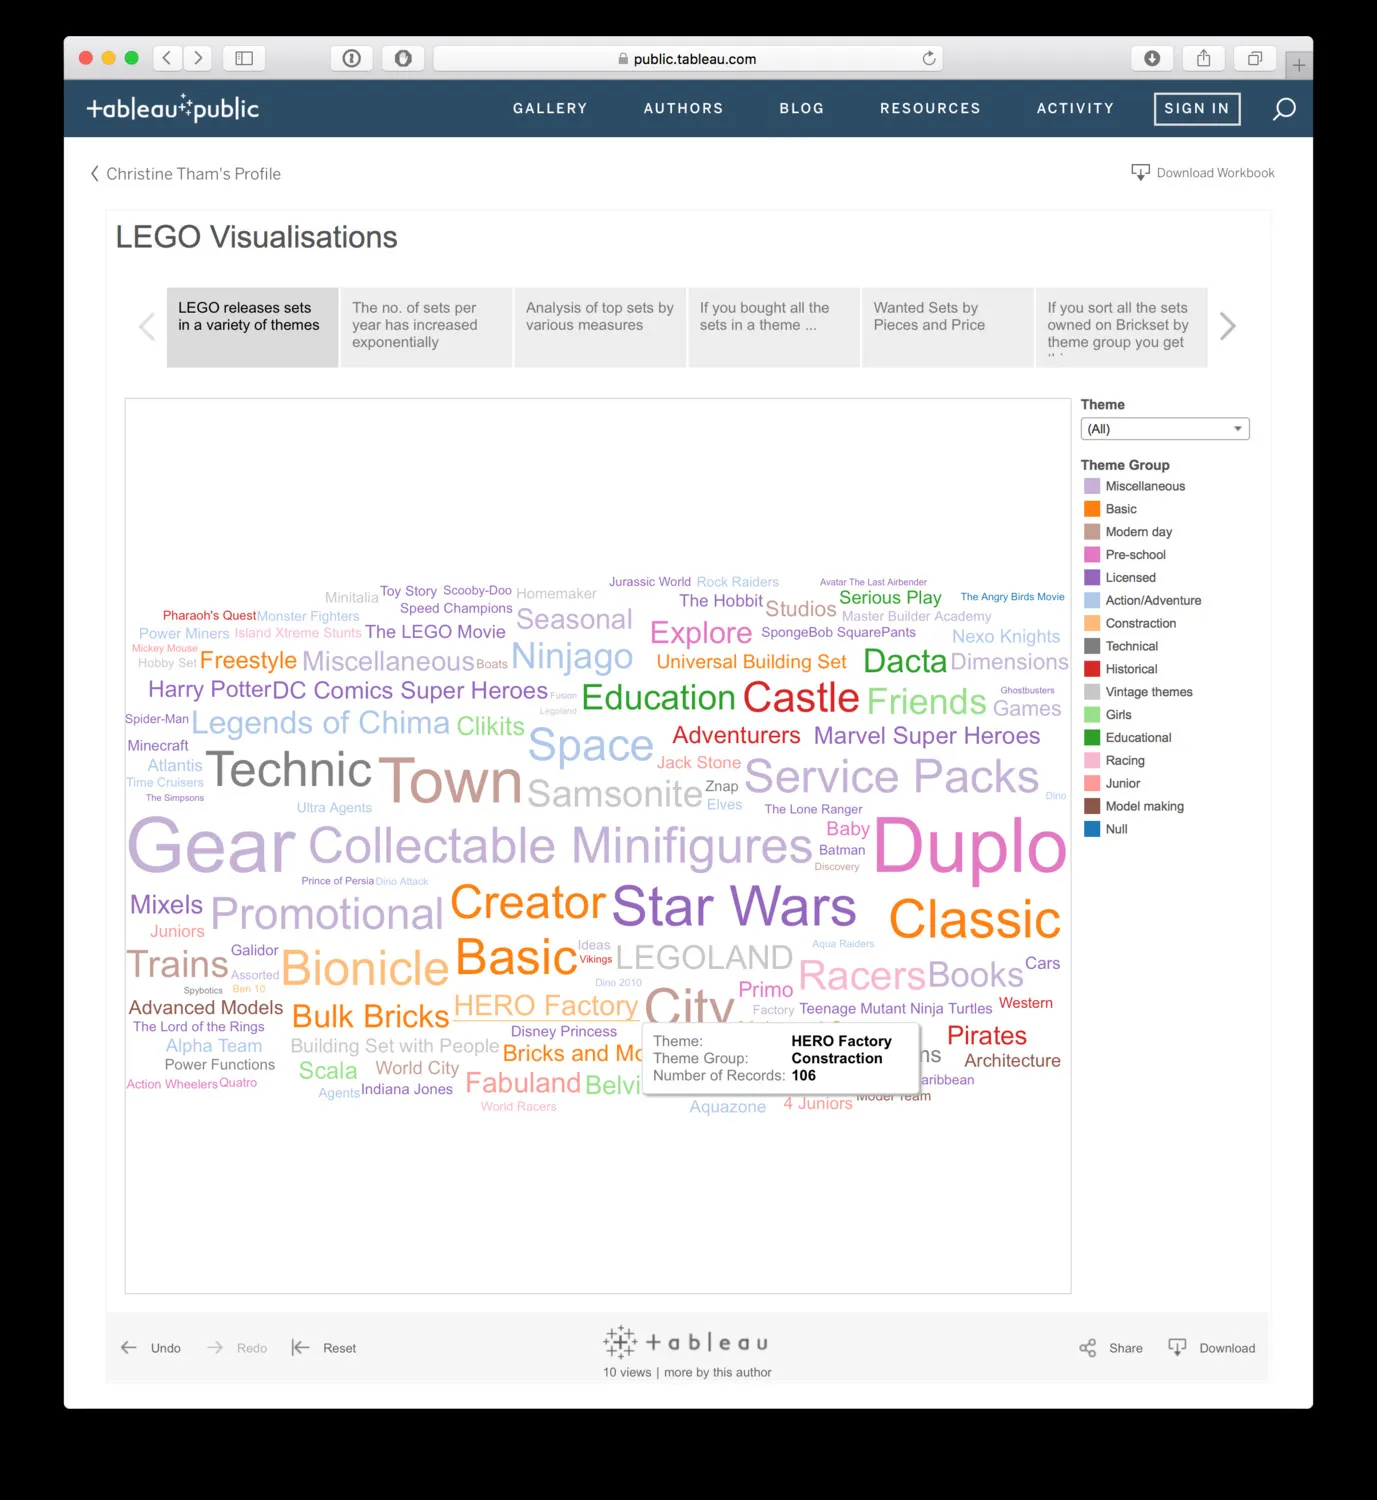
So I decided why not combine my love for LEGO, Python and Tableau by extracting data from Brickset using Python, and then doing some visualisations on Tableau Public?
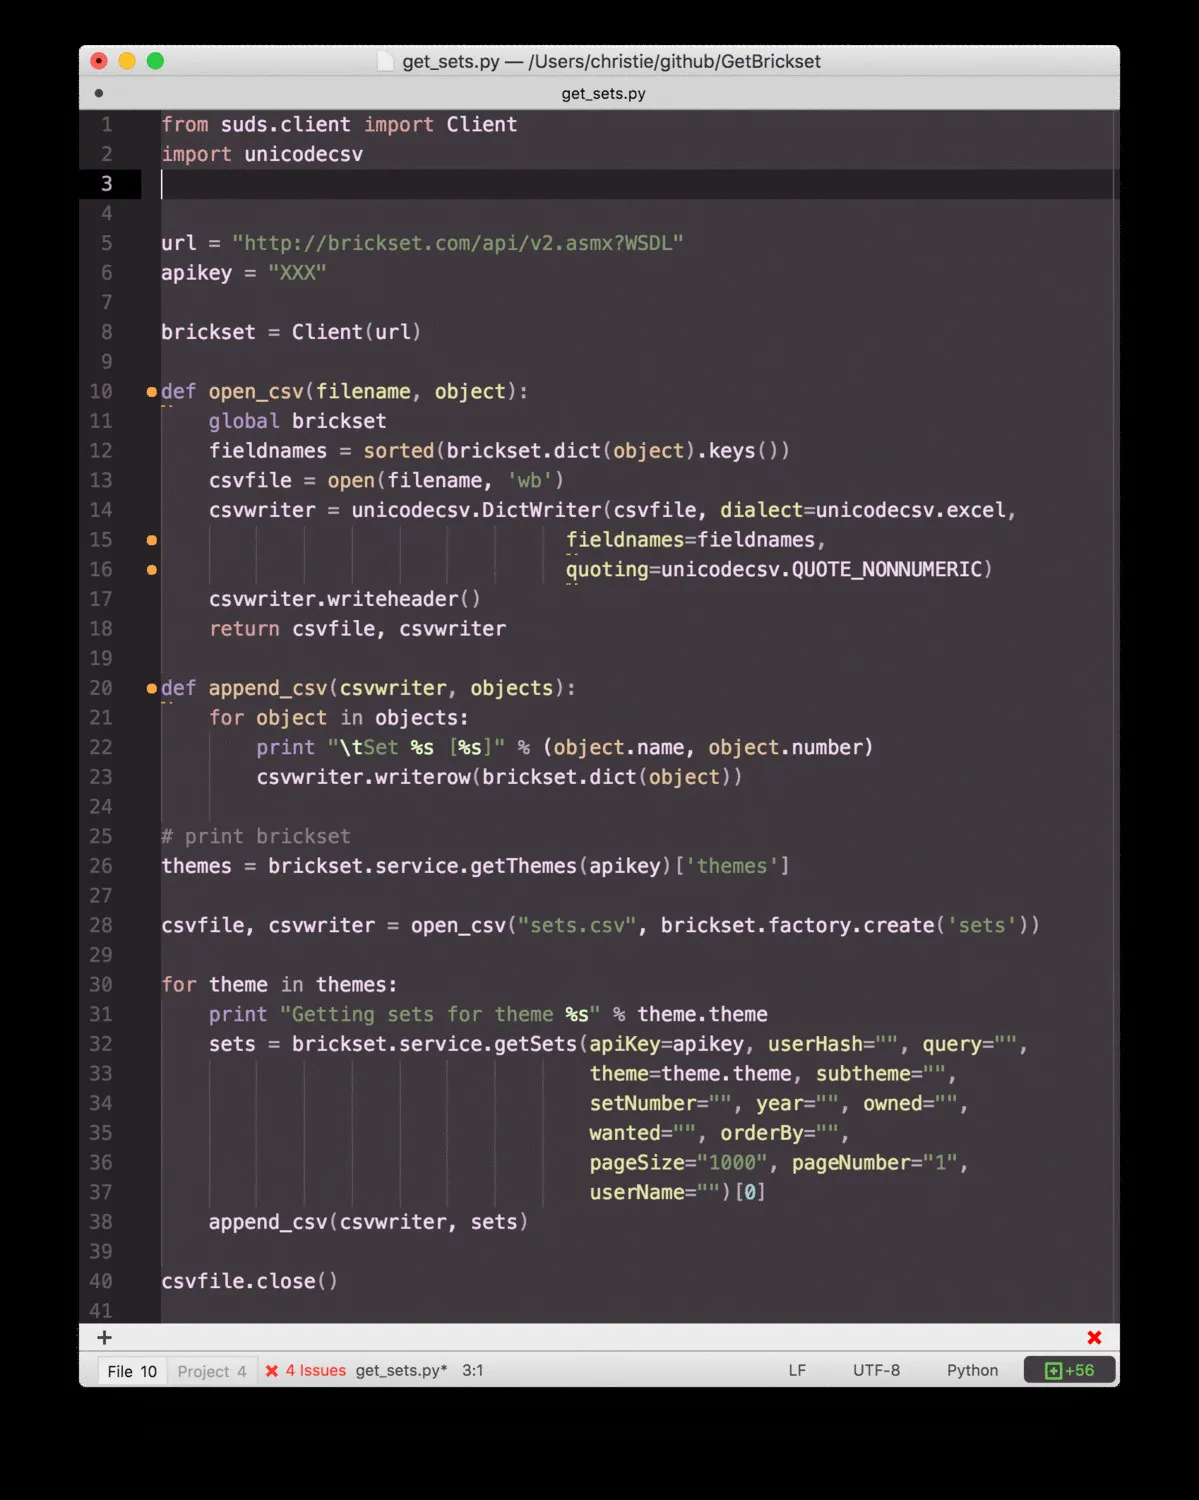
I wrote the following code to extract a list of sets from the database (I have masked my apiKey – to run the code, you will need to request your own apiKey from Brickset):
The visualisations have been posted to Tableau Public. You can enjoy them by clicking on this link:
Link to LEGO Visualisations on Tableau Public